Python
data.csv
x
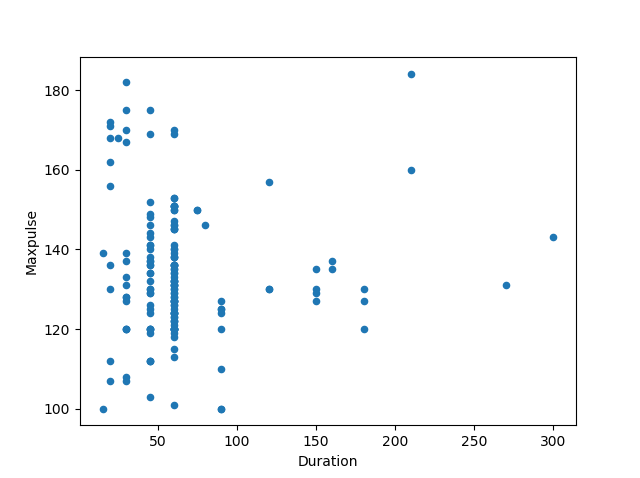
#Three lines to make our compiler able to draw:import sysimport matplotlibmatplotlib.use('Agg')import pandas as pdimport matplotlib.pyplot as pltdf = pd.read_csv('data.csv')df.plot(kind = 'scatter', x = 'Duration', y = 'Maxpulse')plt.show()#Two lines to make our compiler able to draw:plt.savefig(sys.stdout.buffer)sys.stdout.flush()