x
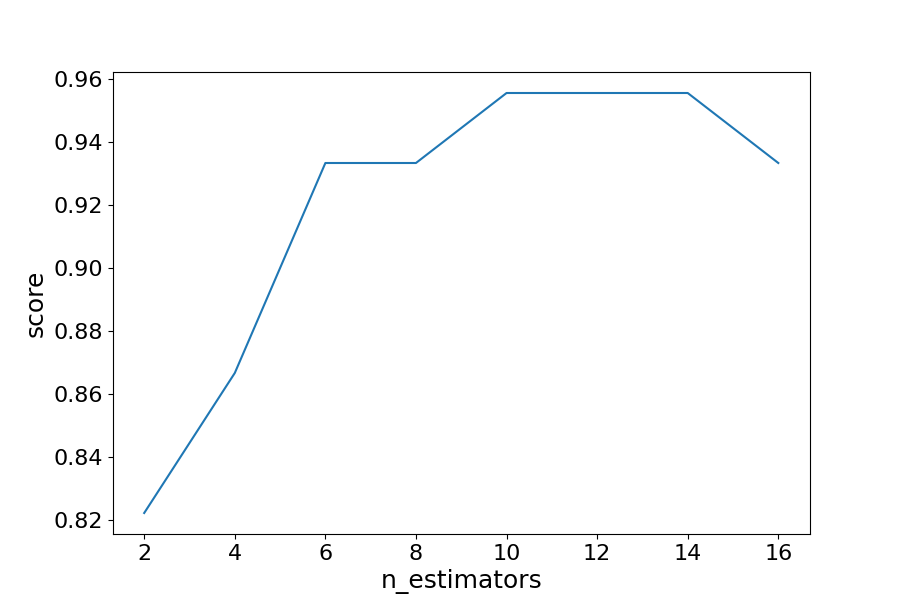
#Three lines to make our compiler able to draw:import sysimport matplotlibmatplotlib.use('Agg')import matplotlib.pyplot as pltfrom sklearn import datasetsfrom sklearn.model_selection import train_test_splitfrom sklearn.metrics import accuracy_scorefrom sklearn.ensemble import BaggingClassifierdata = datasets.load_wine()X = data.datay = data.targetX_train, X_test, y_train, y_test = train_test_split(X, y, test_size = 0.25, random_state = 22)estimator_range = [2,4,6,8,10,12,14,16]models = []scores = []for n_estimators in estimator_range: # Create bagging classifier clf = BaggingClassifier(n_estimators = n_estimators, random_state = 22) # Fit the model clf.fit(X_train, y_train) # Append the model and score to their respective list models.append(clf) scores.append(accuracy_score(y_true = y_test, y_pred = clf.predict(X_test))) # Generate the plot of scores against number of estimatorsplt.figure(figsize=(9,6))plt.plot(estimator_range, scores)# Adjust labels and font (to make visable)plt.xlabel("n_estimators", fontsize = 18)plt.ylabel("score", fontsize = 18)plt.tick_params(labelsize = 16)