x
# We need this line of code to show graphs in our compilerbitmap(file="out.png")# Create a vector of piesx <- c(10,20,30,40)# Display the pie chart and start the first pie at 90 degreespie(x, init.angle = 90)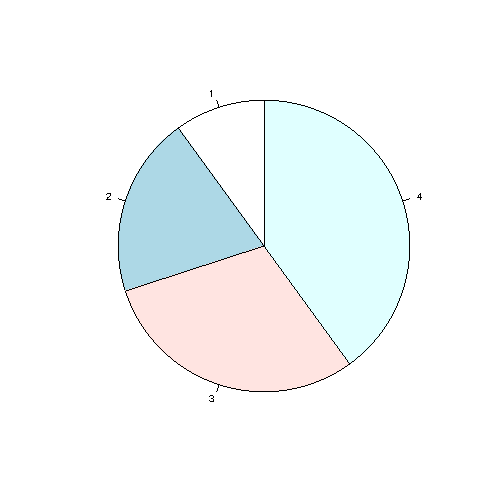
# We need this line of code to show graphs in our compilerbitmap(file="out.png")# Create a vector of piesx <- c(10,20,30,40)# Display the pie chart and start the first pie at 90 degreespie(x, init.angle = 90)